Field notes · 26 October 2026
Molinia vs sphagnum: telling them apart in satellite imagery
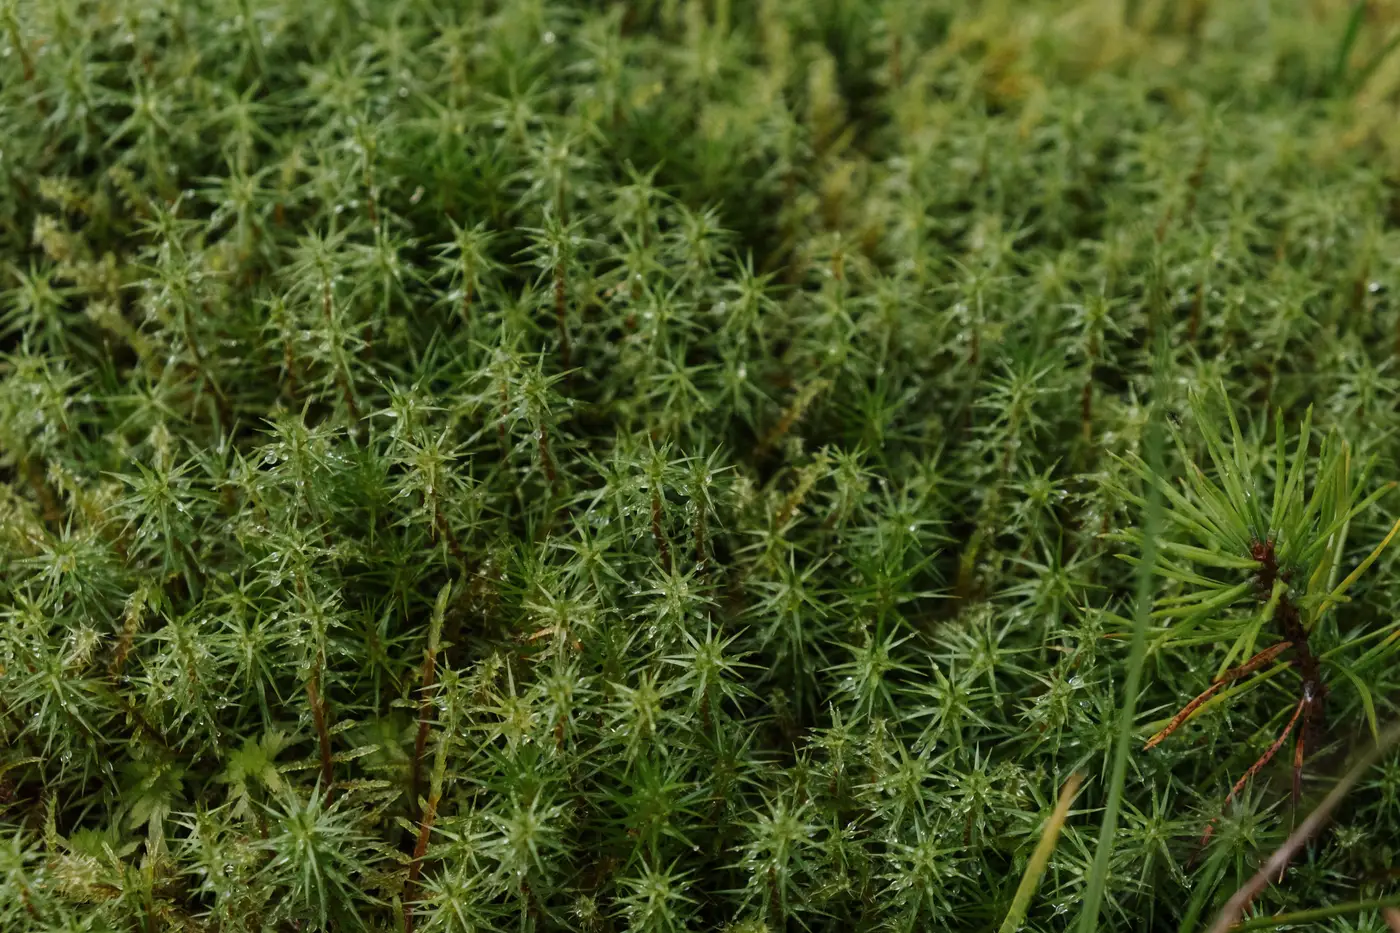
If you've walked a restoration compartment and found tussocks of purple moor grass muscling into what should be a sphagnum lawn, you already know the problem on the ground. Seeing that shift from above, consistently enough to track a whole site without sending a crew to every grid square each year, means picking the right season and the right index for the job.
Molinia caerulea and sphagnum behave differently through the year, and that seasonal behaviour is what shows up in a spectral signal more clearly than any single snapshot can capture.
Why molinia shows up where sphagnum should be
Molinia is a drying-peat signal. It moves in where the water table has dropped, drains are still open, or burning has knocked back the bog species and left space for a grass that can root into a firmer, drier surface. Once it's established, it forms dense tussocks with heavy litter buildup, and that litter does something useful for anyone reading imagery: it senesces hard. By late autumn, a molinia-dominated area turns a distinctive tawny, straw-yellow colour and stays that way through winter, while a healthy sphagnum lawn holds its green and deep red-brown tones through the same period because it doesn't die back the same way.
That's the single biggest tell, and it's a timing problem as much as a spectral one. A summer image taken at peak green-up can make molinia and a vigorous sphagnum carpet look confusingly similar in a simple vegetation index. The same ground, imaged in November, separates cleanly. Tracking this shift means picking the autumn pass, when the contrast is clearest, over a summer reading that flattens the difference.
Picking the indices and the imagery window that separate them
NDVI alone tells you how green something is, not what it is. A molinia stand at height in July can post an NDVI reading close to a flourishing sphagnum lawn, because both are producing a lot of live biomass. The separation comes from combining that with:
- Seasonal NDVI trajectory, not a single reading. Molinia's steep autumn crash versus sphagnum's much flatter curve through the year is more diagnostic than any one pass.
- Moisture-sensitive bands, since sphagnum's cell structure holds water very differently to a grass canopy, and that shows up in near-infrared and shortwave response even outside the senescence window.
- Texture and cover density, because molinia tussocks create a patchier, higher-contrast canopy structure than an even sphagnum lawn, which matters more at finer resolution but still influences how an index reads at coarser scale.
None of this replaces ground-truthing. A single spectral reading won't tell you species composition the way a quadrat survey will. What it can do, if you're checking the same compartments every year on a consistent cadence, is flag where the signal has shifted since the last pass, drying out, browning earlier, losing the sphagnum signature, so a site visit goes to the hectares that actually changed instead of a blanket walkover of the whole restoration area.
For a programme tracking peat condition against a funded plan, the practical use of this distinction is a year-over-year read: it shows where molinia is gaining ground and where the re-wetting work is giving sphagnum room to come back. An annual condition layer built around exactly this kind of change detection is what turns a seasonal imagery quirk into something you can report against a restoration target.
If your funded plan needs that comparison run every year rather than argued over from a single image, Peatland Monitoring is worth a look.