Peatland Monitoring

Find out which blocks of your restoration area have slipped since last year.

An early-access annual read on peat condition: drainage signals, burn scars and bare peat, flagged from satellite imagery and listed against your baseline.

GSD
Wide / 10–30 m
Cadence
Annual
Platform
Wide-swath satellite
Spectral
Multispectral

Early access

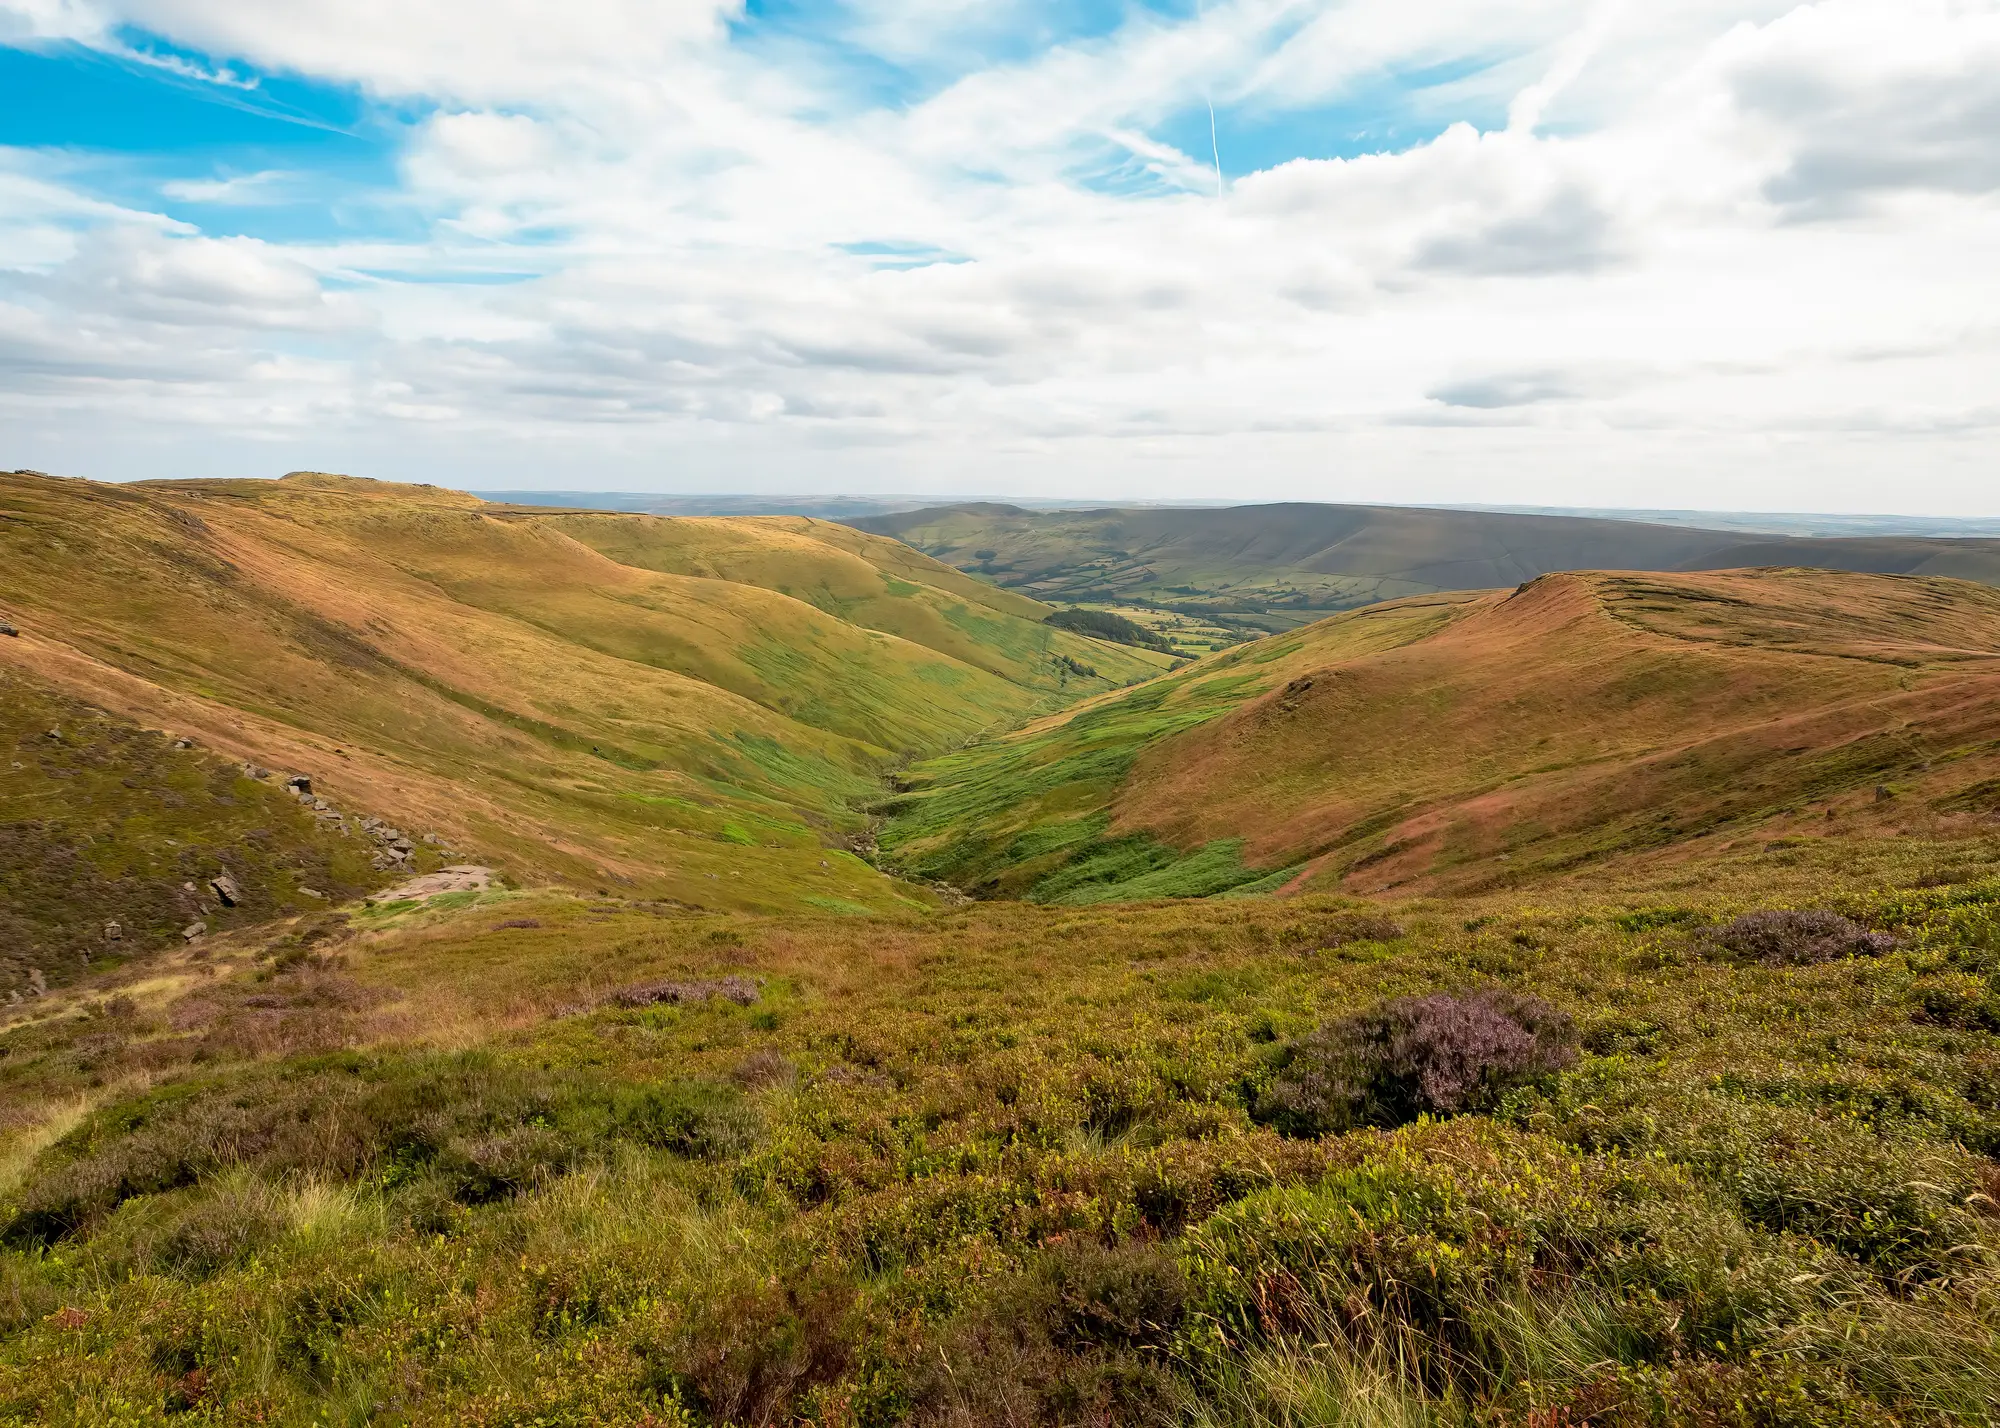
A heather and grass moorland clough running down between brown peat slopes under a broken sky
Fig. 1 Upland moor in late summer: heather and grass over peat, with a clough cutting down through the block.

01The job today

How condition gets reported between surveys

You run a restoration programme against a funded plan. The baseline survey was done before the works, the contractors have blocked drains across the priority blocks, and the funder wants to know each year how the area is doing.

What you have to answer with is patchy. There are walkover notes from the blocks people happened to visit, a drone flight over the one block you could afford to fly, and perhaps a consultant's report that stopped at the edge of last summer. The rest of the area is assumed to be recovering because nobody has seen otherwise. A stretch that has started drying out again, a small burn that took hold in a dry spell, or a run of bare peat opening up on a slope can sit there through a whole season. You find it on a site visit, or the funder's officer finds it first.

Field survey is the right way to confirm what is happening on the ground, and nothing here replaces it. What is missing is a repeatable look across the whole area once a year, so that the visits go where something has changed. That is what this early-access service is meant to be: an annual layer and a change list for your restoration area, held against your baseline.

It is early access. The methods and coverage are still being proven.6

02What you get

What early participants would receive

The service is not yet a general release. Early participants would receive the following for their restoration area.

  1. 2.1

    Annual condition layer

    GIS layer, GeoPackage or shapefile

    One layer per year for your restoration area, with patches flagged for drainage signal, burn scar and bare peat. It opens in QGIS or ArcGIS next to your own boundaries and baseline.12

  2. 2.2

    Change flag list

    CSV

    Each patch that differs from the previous year, with its location, its type and the year it first shows. This is the list you take to the next site visit, so the walkover starts at the patches that changed.5

03

How it works

  1. Send us the restoration area

    A boundary as a shapefile or GeoPackage, and your baseline survey if you have one. Tell us which year your plan started.

  2. We source the imagery

    Wide-swath multispectral imagery is chosen each year, using the best cloud-free pass available for the area.4

  3. Indices and change detection

    Spectral indices are calculated for the area and compared year on year. Patches that have dried, burnt or bared are flagged.

  4. You get the layer and the list

    The condition layer and the change flag list arrive as files you can open in your own GIS, measured against your baseline.

  5. Next year

    The new year is added to the same record, and the change list shows what moved since the last one.3

04

Where it fits

The annual milestone report
A repeatable layer to put beside the funder's milestones, clearly labelled as an early-access product.
Planning the season's visits
A change list that tells the survey and contractor crews which blocks to look at first.
Catching a new burn or drying block early
A flag in the yearly layer, ahead of the next scheduled survey.

05

Limits

These are the ways an annual satellite read of peat condition can mislead you.

Schematic peat cross-section with numbered markers1234567
  1. Intact surface: vegetation cover over wet peat.
  2. A drain or grip, much narrower than one pixel.
  3. Drying peat beside the drain. This is what the drainage signal picks up.
  4. Bare peat, with no vegetation cover.
  5. A burn scar, seen as a change from the year before.
  6. One 10–30 m pixel. It covers the drain and the drying ground around it.
  7. The water table (dashed), drawn down beside the drain.
Fig. 3Schematic, not to scale. A peat cross-section showing what the layer flags, and why individual ditches are not traced.
  1. Limit 1

    10–30 m is the floor

    A pixel covers a patch of ground much wider than a drain. Individual ditches and grips are not traced. The drainage signal marks areas that look drier than before, and it draws no ditch lines. Small or patchy burns and thin bare patches below that scale can be missed.

  2. Limit 2

    A physical read, not a carbon figure

    The layer flags surface condition: drainage signal, burning and bare peat. It gives no carbon flux, no emissions total and nothing you could use in a carbon claim.

  3. Limit 3

    Annual, not real-time

    One read per year. A burn in spring may not be flagged until the next annual layer.

  4. Limit 4

    Cloud decides the pass

    Each year uses the best cloud-free pass available for your area. A cloudy year may leave a poor scene or none, and the layer says so.

  5. Limit 5

    Indices are a prompt for a visit

    A flagged patch is a place to look, not proof of degradation. Only the ground can confirm it.

  6. Limit 6

    Early access

    Methods and coverage are still being proven. Expect the output to change as the work develops.

06

Who it's for

  • Programme managers running a funded peatland restoration who need an annual read across the whole area.
  • Restoration teams who want their site visits pointed at the blocks that changed.
  • Programmes that already hold a baseline survey and want to measure later years against it.

Who it's not for

  • Teams that need a carbon emissions figure, a verified reduction or a credit claim.
  • Teams who need ditch-by-ditch mapping of small drains. A drone survey does that better.
  • Real-time or monthly monitoring.
  • Buyers who need a guaranteed restoration outcome or a finished, production service.

07FAQ

Questions before you sign up

Is this a finished product?

No. It is early access. The methods and coverage are still being proven, so signing up joins a pilot list and does not place a live order.

Does it measure carbon emissions?

No. It flags physical condition: drainage signal, burning and bare peat. It gives no carbon flux figure.

How small a feature can it see?

The imagery has a 10–30 m ground sample distance. Individual drains, small burns and thin patches of bare peat below that scale may not show.

How current is it?

Annual. Each year's layer uses the best cloud-free pass available for that year.

Does cloud cover affect it?

Yes. A cloudy year can leave a weak scene or none, and the layer states which.

How do we check it against our own survey?

Flagged patches are located so you can compare them with your baseline survey, walkover notes or drone flights. Tell us where your ground truth is and we can look at the two side by side.

Can we use the layer in our funder report?

You can use the layers as one input, labelled as early-access. Terms for use of the delivered files are set out before work starts. It does not verify restoration outcomes.

How would it be priced?

Early participants agree the scope for their area first, and the cost model is set out in writing then. Nothing is fixed yet.

Tell us your restoration area and join the early-access list.

Request early access