Field notes · 26 October 2026
How to report peatland restoration progress to a funder using satellite imagery
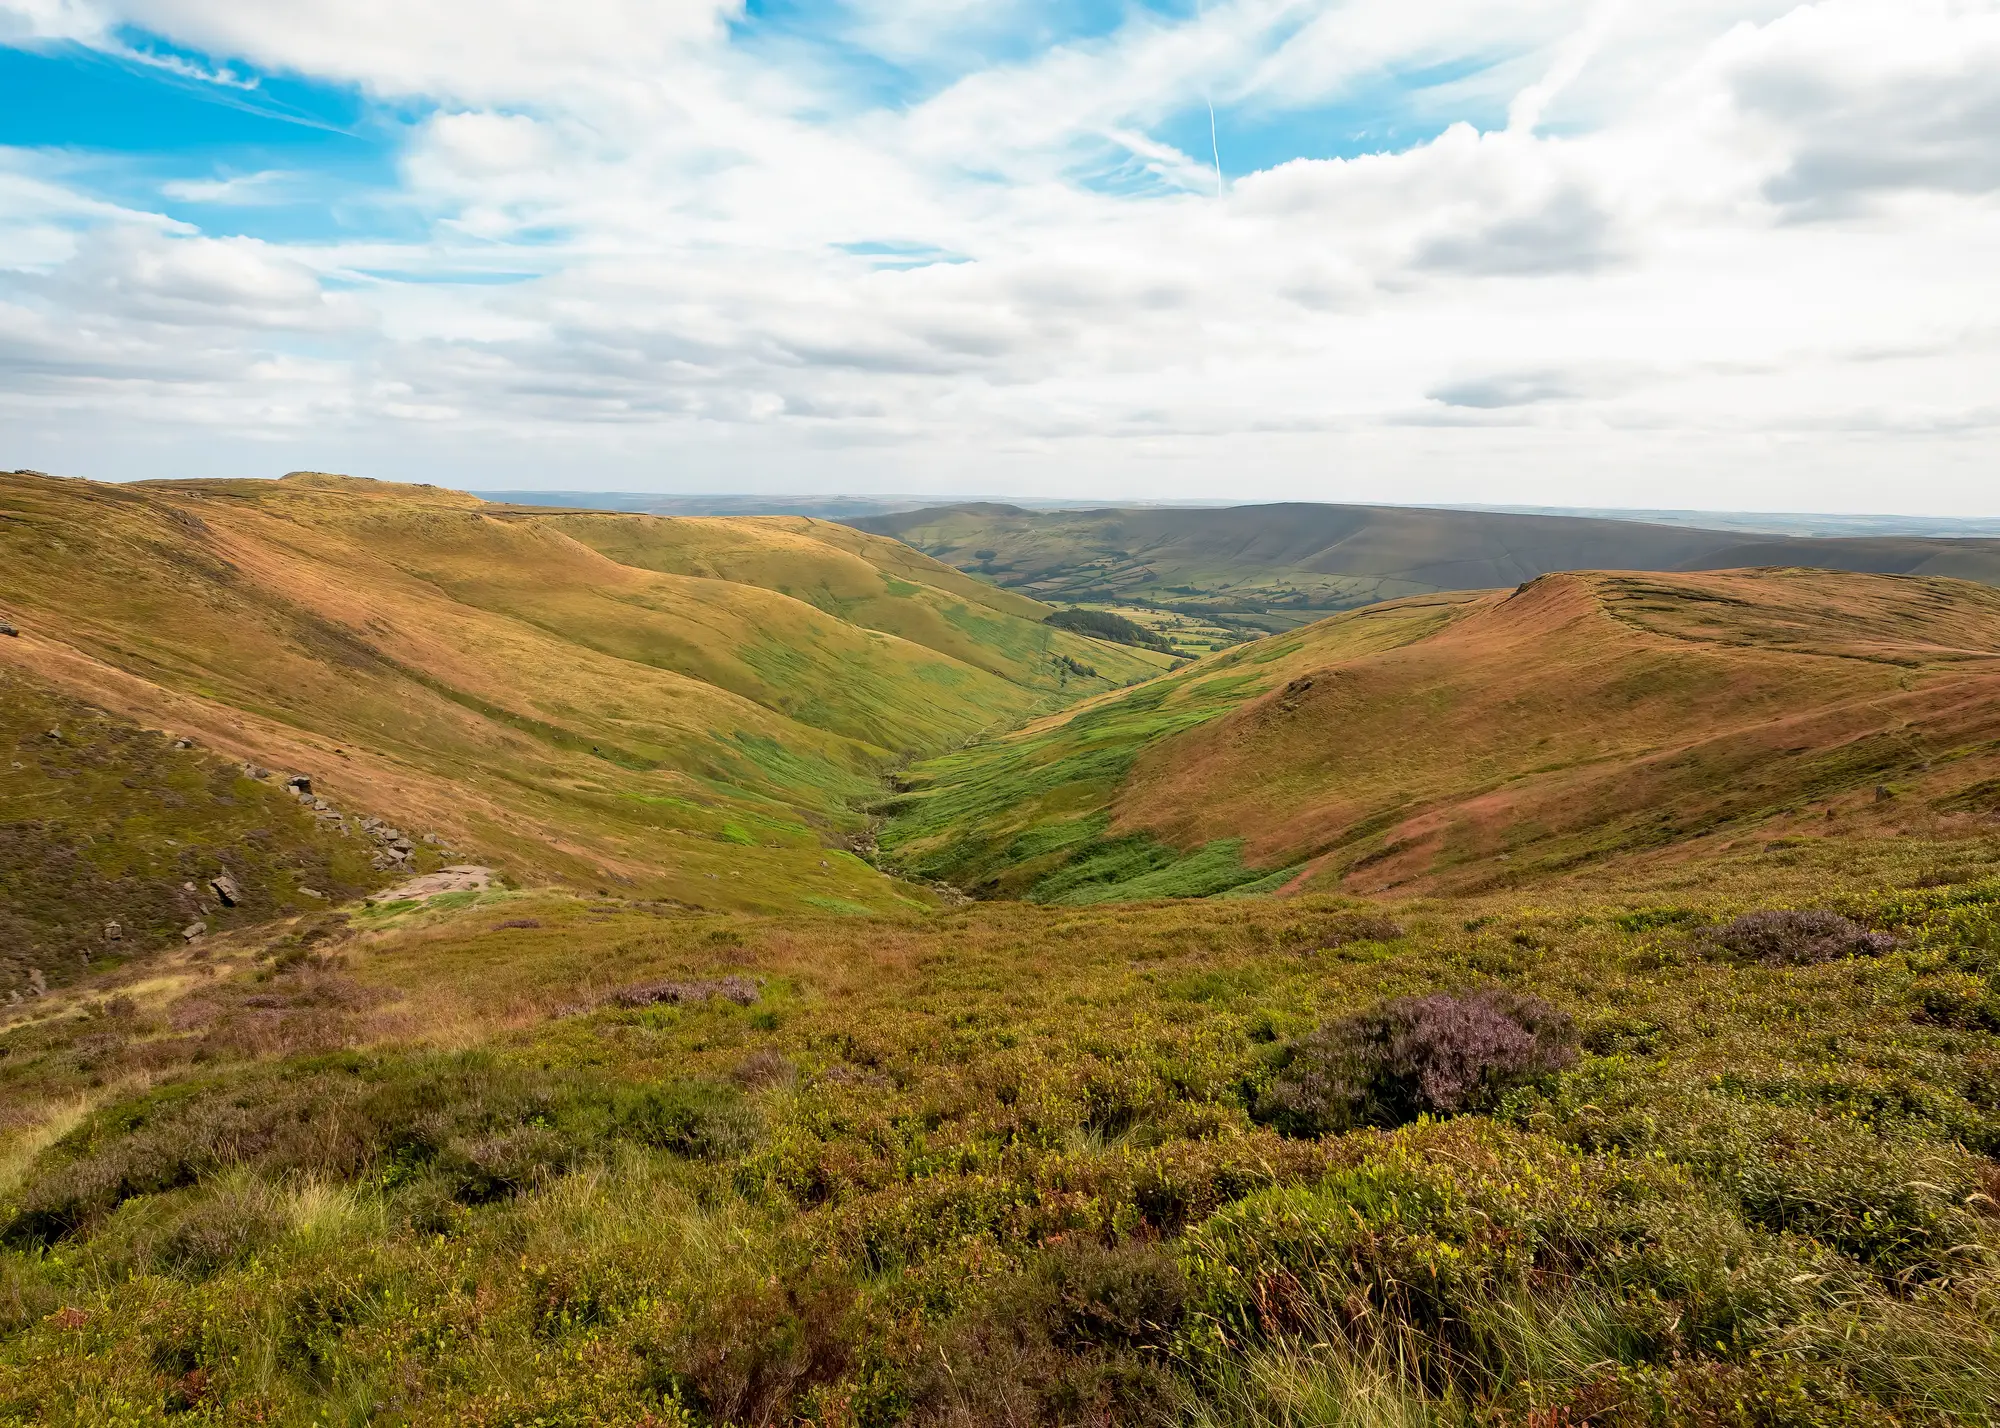
Most peatland restoration grants run three to ten years, and most funders want an annual update somewhere in that window that shows the money is doing what it said it would. A site visit covers maybe a tenth of a restoration area in a day. The photos from that visit document the ten square metres someone stood on, while the grant covers four hundred hectares.
Satellite imagery doesn't replace the site visit. It fills the gap between visits, which is most of the reporting period, and gives the funder something to look at that covers the whole area rather than the accessible bits of it.
What a funder wants in the report
Funders reading a peatland restoration report are usually trying to answer one question: is condition moving in the right direction, or is it not. They don't need raw spectral data and they rarely ask for it. What they want is a clear read on where drainage is still active, where burning has happened since the last report, and where bare peat is exposed and emitting. An annual condition layer gives you that read once a year, pulled from the same wide-swath source each time, so this year's map and last year's map are comparable instead of being two different surveys stitched together under one heading.
That comparability matters more than people expect going in. A funder who gets a report with a different methodology every year starts asking why the numbers don't line up. A report built on the same annual pass, same indices, same area boundary, holds up better across the life of a multi-year grant.
Building the change flag list into the report
The part of the report that usually lands best with a programme officer is the list underneath the condition map: the specific parcels or compartments where drainage, burning or bare peat exposure showed up compared with last year's pass. A change flag list pulled from those three signals gives you a short, dated set of locations to walk through rather than a wall of green on a map that nobody can interrogate.
In practice this turns the annual report into something closer to an exception list. Most of the restoration area holds steady between years, which is the whole point of the grant, and the report can say so in one line. The flagged parcels are where the narrative goes: why did drainage show up again in compartment 4, was the bare peat in the eastern block already noted at the baseline survey, has the burn scar from two winters back started to vegetate.
Where ground data still does the work
Ground visits still carry the parts of the story imagery can't tell. A flag on a change list points a field team to a location worth checking. Working out what caused the change there, and what to do about it, is still a site visit's job.
Restoration programme reporting that leans entirely on remote condition data without any site corroboration will get picked apart by a funder who knows the ground, and should. The imagery earns its place by covering the area between visits and by giving the field team a shortlist instead of a blank map to walk.
This is also still an early-access read rather than a finished, validated product you can drop straight into a funder template. Spectral indices flag likely drainage, burning and bare peat exposure. They don't certify restoration outcomes on their own, and a report that treats them as certification will overstate what the data supports.
If you're putting together next year's funder update now, Peatland Monitoring is building the annual condition layer and change flag list this post describes, for programme teams who want that gap between site visits covered before the next reporting deadline lands.
Programme teams writing their next grant report can get on the early-access list and see what the first condition layer for their restoration area would flag.